As the summer market hits its stride, July brought a mix of momentum and adjustment to the Durham Region real estate landscape. Buyers continue to benefit from rising inventory levels, while sellers face a market that demands sharper pricing strategies and polished presentation. These trends reinforce the ongoing shift toward more balanced conditions, moving further away from the highly competitive seller’s market of recent years.
Across the region, both new listings and sales climbed year-over-year, giving buyers more choice and opportunities to negotiate. However, average prices have edged lower in many municipalities compared to last July, reflecting improved affordability and a market environment where strategic offers are gaining traction.
Here’s a detailed breakdown of how the Durham market performed this month.
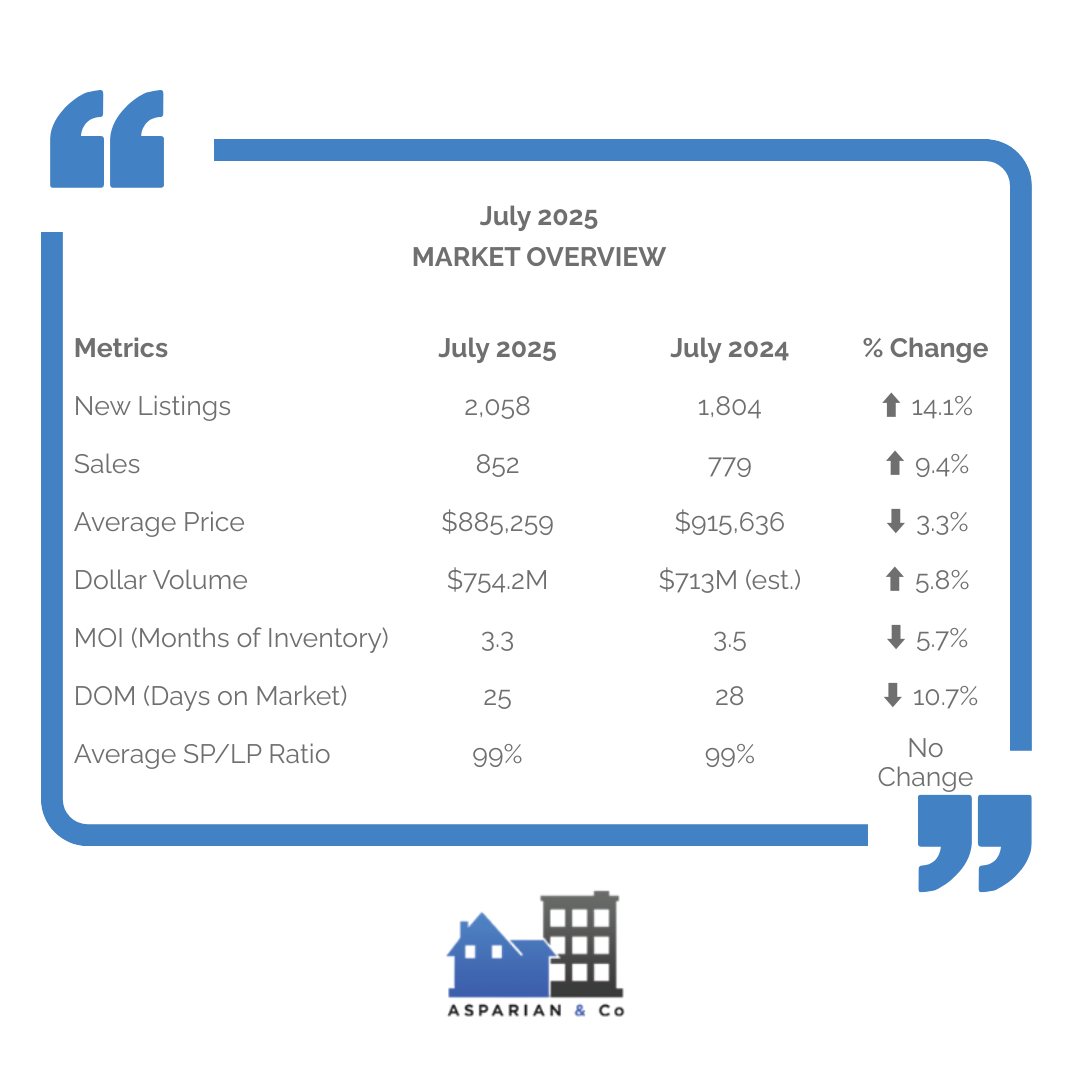
MARKET OVERVIEW
July 2025 continued the region’s movement toward a more balanced real estate market in Durham Region. Sales rose 9.4% year-over-year, while new listings climbed 14.1%, expanding choice for buyers and easing some of the competitive pressure seen in recent years. The average selling price edged down 3.3% to $885,259, signaling improved affordability and a softening from last summer’s peak values. For sellers, success now hinges on accurate pricing and strong presentation, while buyers can approach the market with greater confidence and leverage in negotiations.
CITY-BY-CITY BREAKDOWN
- Oshawa
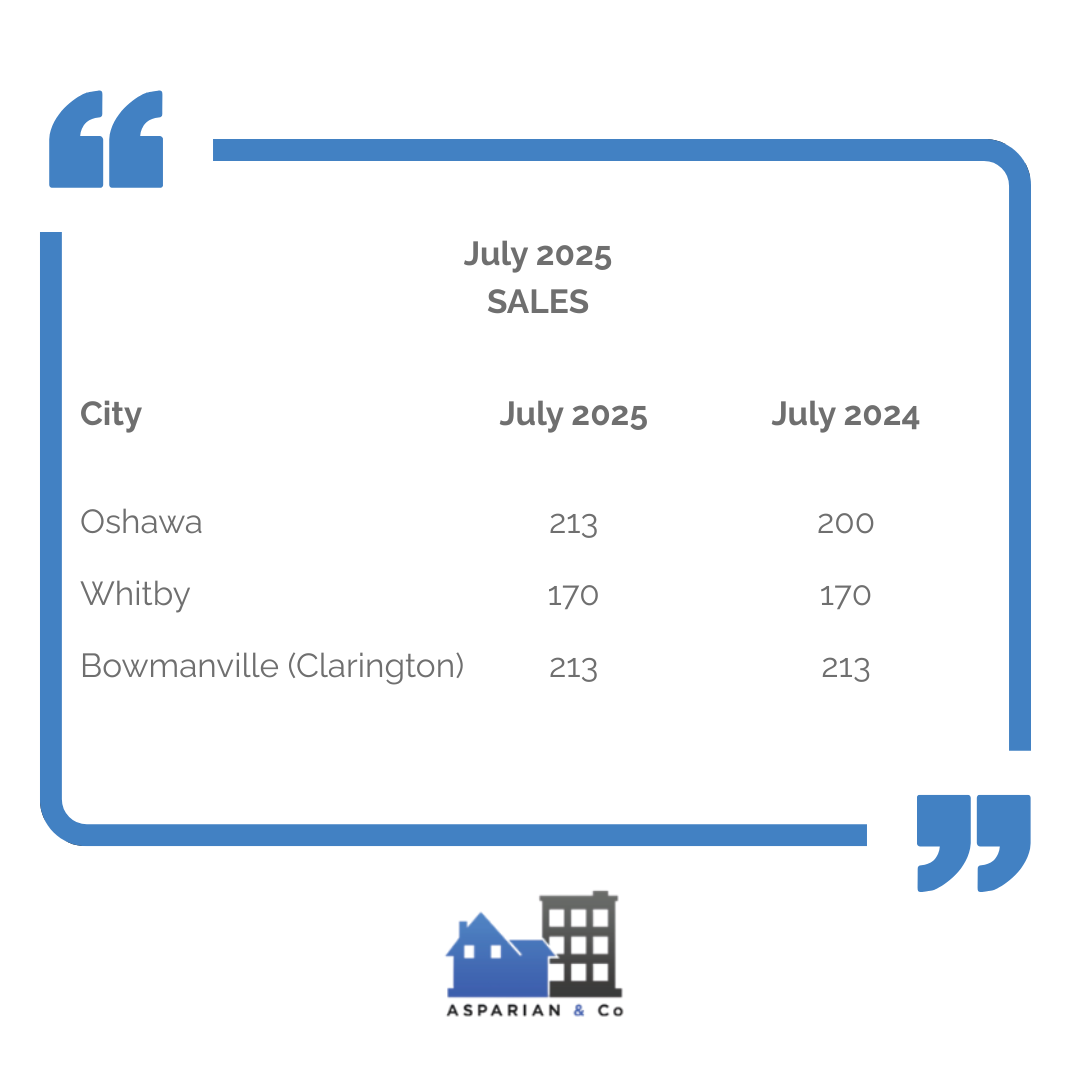
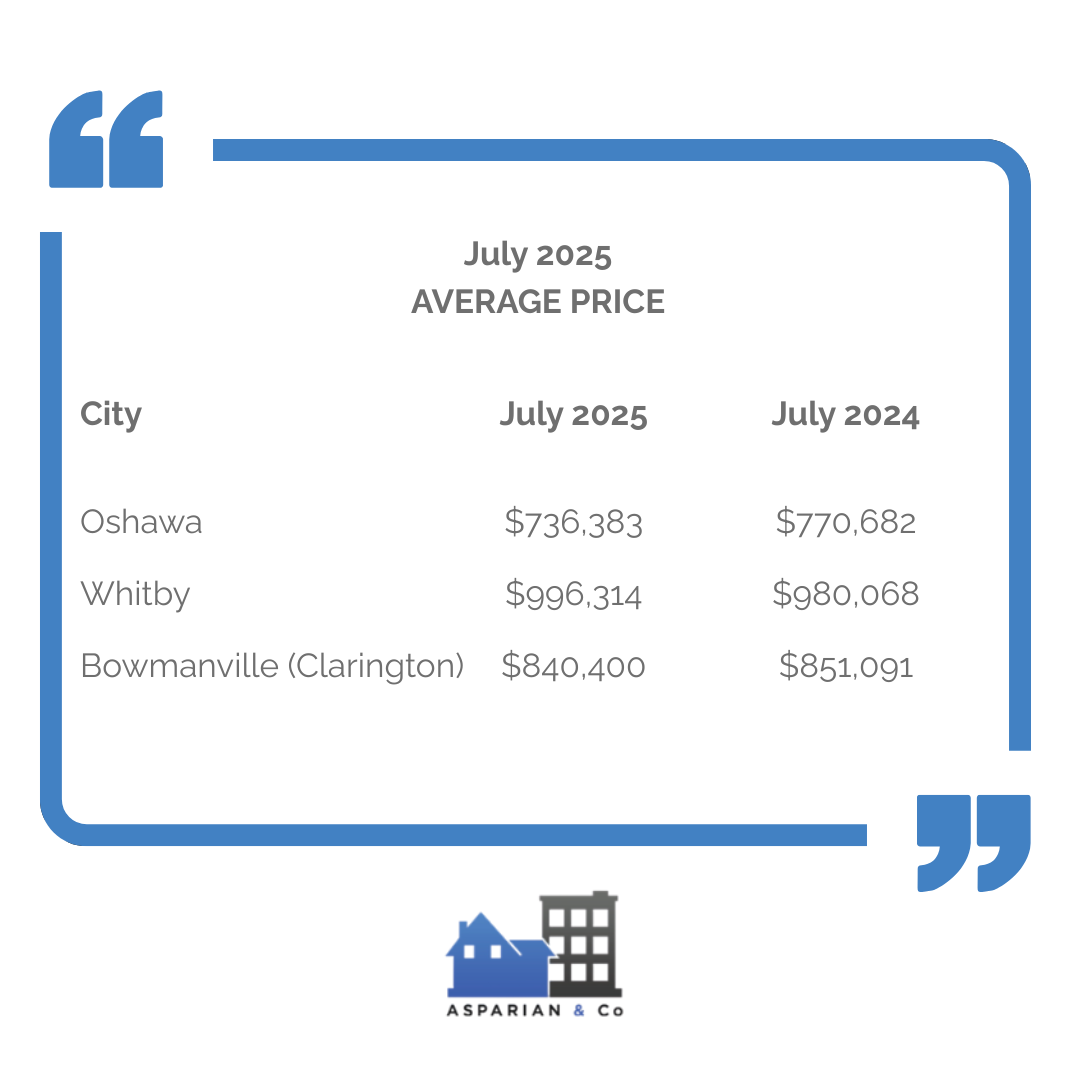
Oshawa’s housing market in July 2025 experienced a 6.5% increase in sales compared to last year, reaching 213 transactions, while new listings held nearly flat at 575. The average selling price declined 4.5% to $736,383, signaling improved affordability and creating opportunities for buyers to enter the market at more accessible price points. Months of inventory eased to 3.5, and homes sold more quickly, with days on market dropping to 22, reflecting healthy buyer activity. For sellers, this environment still rewards well-priced and well-presented listings, while buyers gain the advantage of more options and slightly reduced competition compared to past peak markets.

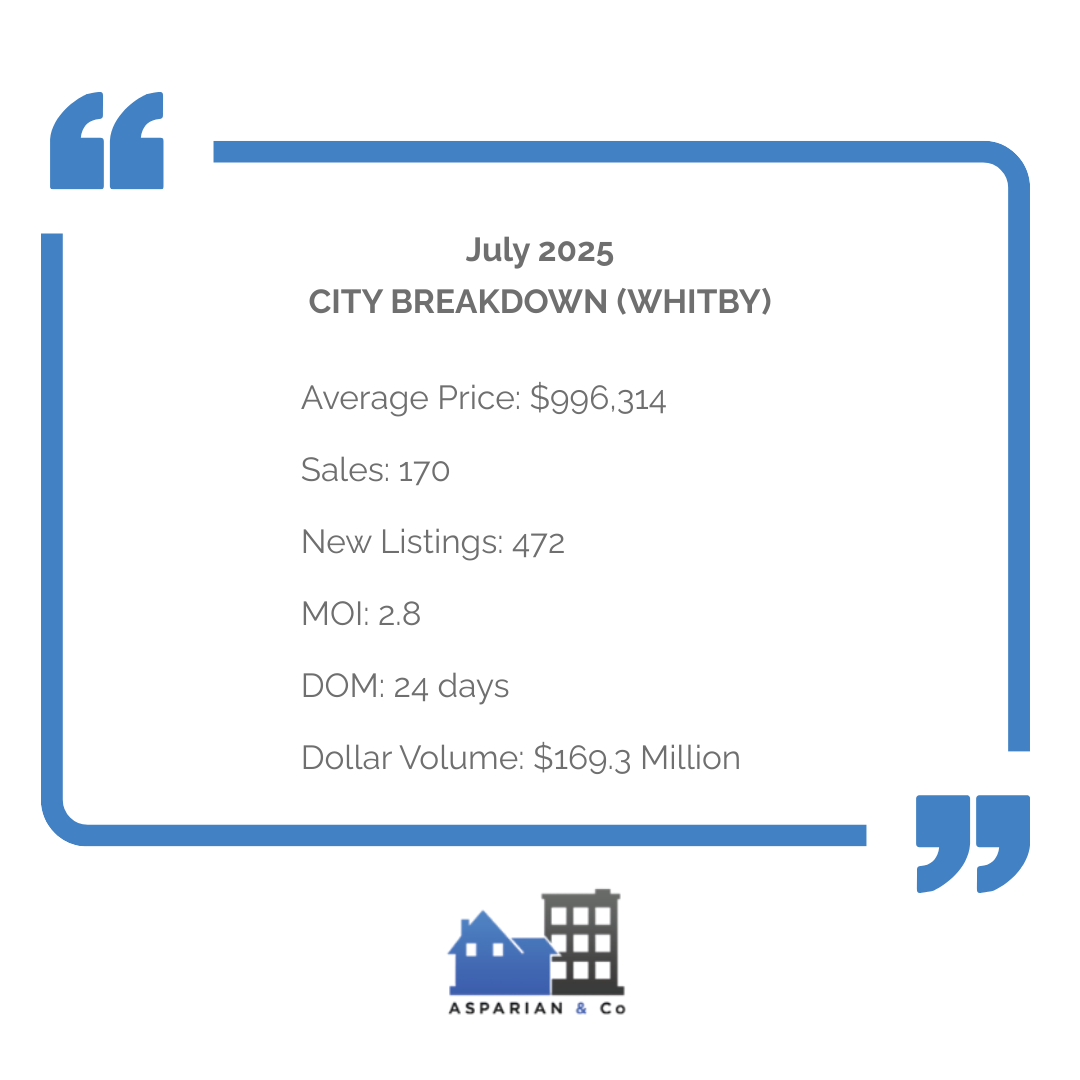
- Whitby
Whitby’s market activity in July 2025 remained steady, with sales holding level year-over-year at 170 transactions despite a notable 26.9% increase in new listings. The average selling price rose 1.7% to $996,314, suggesting that well-positioned properties are still attracting strong offers even in a more competitive environment. Inventory levels, measured at 2.8 months, remain relatively tight, but a modest increase in days on market to 24 indicates buyers are taking slightly longer to make purchasing decisions. For sellers, this balance means pricing precision is essential, while buyers benefit from a broader selection without facing the urgency of past markets.
- Bowmanville
In Bowmanville, July saw stable sales volumes compared to last year, with 213 homes sold, but a 13.0% drop in new listings tightened supply. The average price eased 1.3% to $840,400, while dollar volume dipped 2.8%, reflecting measured buyer activity amid constrained inventory. Months of inventory fell to just 2.3, reinforcing its position as one of Durham’s more competitive submarkets, and homes sold faster on average, with days on market down to 37. This combination of steady demand and reduced supply favors sellers, but buyers who are well-prepared can still secure opportunities in a market where choice is limited.

CITY-BY-CITY COMPARISON
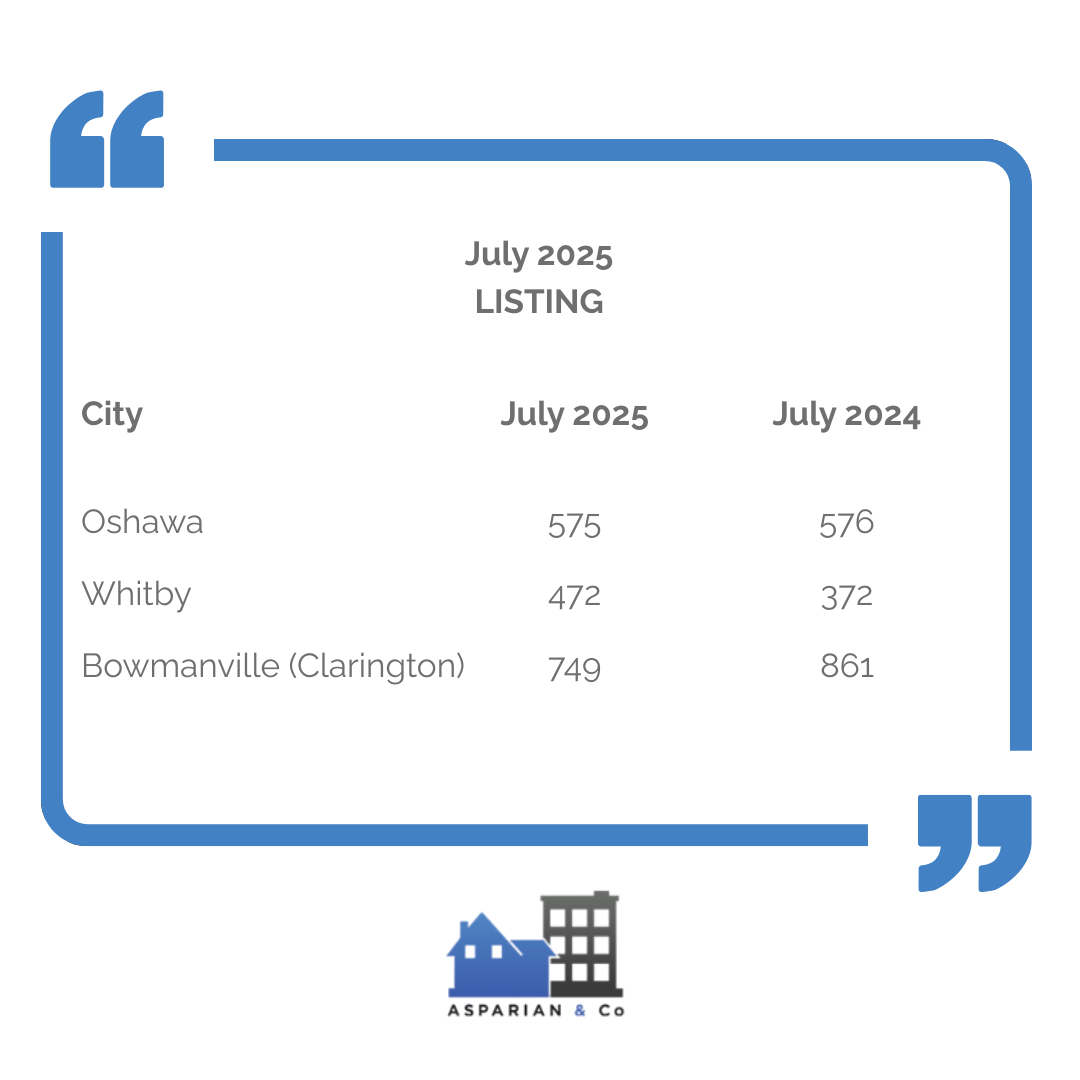
Listings Comparison
July 2025 saw divergent trends in new listings across Durham’s key markets. Whitby posted the most substantial year-over-year increase, with a 26.9% jump in new inventory, offering buyers a significantly wider selection than last summer. Oshawa remained stable, recording only a 0.2% dip in new listings, maintaining a consistent level of choice for purchasers. In contrast, Bowmanville (Clarington) experienced a notable 13.0% drop, tightening supply and potentially fueling greater competition for desirable properties in that area.
Sales Comparison
Sales activity reflected varying levels of buyer engagement across municipalities. Oshawa led in growth with a 6.5% year-over-year rise, demonstrating steady demand despite broader market shifts. Whitby’s sales held level with last July, suggesting that increased inventory has yet to translate into higher absorption rates. Bowmanville mirrored Whitby’s flat performance, with transactions holding steady, indicating a balanced interplay between supply constraints and buyer demand.
Average Price Comparison
Price trends diverged subtly among the three cities, underscoring the nuanced nature of the current market. Whitby stood out with a 1.7% increase in average selling price to $996,314, pointing to resilience in its upper-tier property segment. Oshawa, conversely, recorded a 4.5% decline to $736,383, reflecting improved affordability and potential opportunities for first-time buyers. Bowmanville saw a modest 1.3% dip to $840,400, suggesting stable valuations in the face of reduced supply.
MOI (Months of Inventory) Comparison
Inventory conditions varied notably, shaping the competitive landscape in each market. Bowmanville remained the most competitive with just 2.3 months of inventory, indicating a stronger tilt toward sellers. Whitby followed closely at 2.8 months, reflecting balanced yet still relatively tight conditions. Oshawa posted the highest MOI at 3.5, suggesting slightly more breathing room for buyers and a softer pace of market turnover compared to its neighbors.

Dollar Volume Comparison
Dollar volume trends revealed the combined impact of sales counts and price movements. Whitby led with $169.37 million in total sales value, a slight increase from last year, supported by steady sales and modest price growth. Oshawa followed closely with $156.85 million, edging up 1.8% year-over-year despite price declines, thanks to higher transaction counts. Bowmanville, with $147.07 million in volume, saw a 2.8% dip, reflecting the effect of both fewer listings and slightly lower average prices.

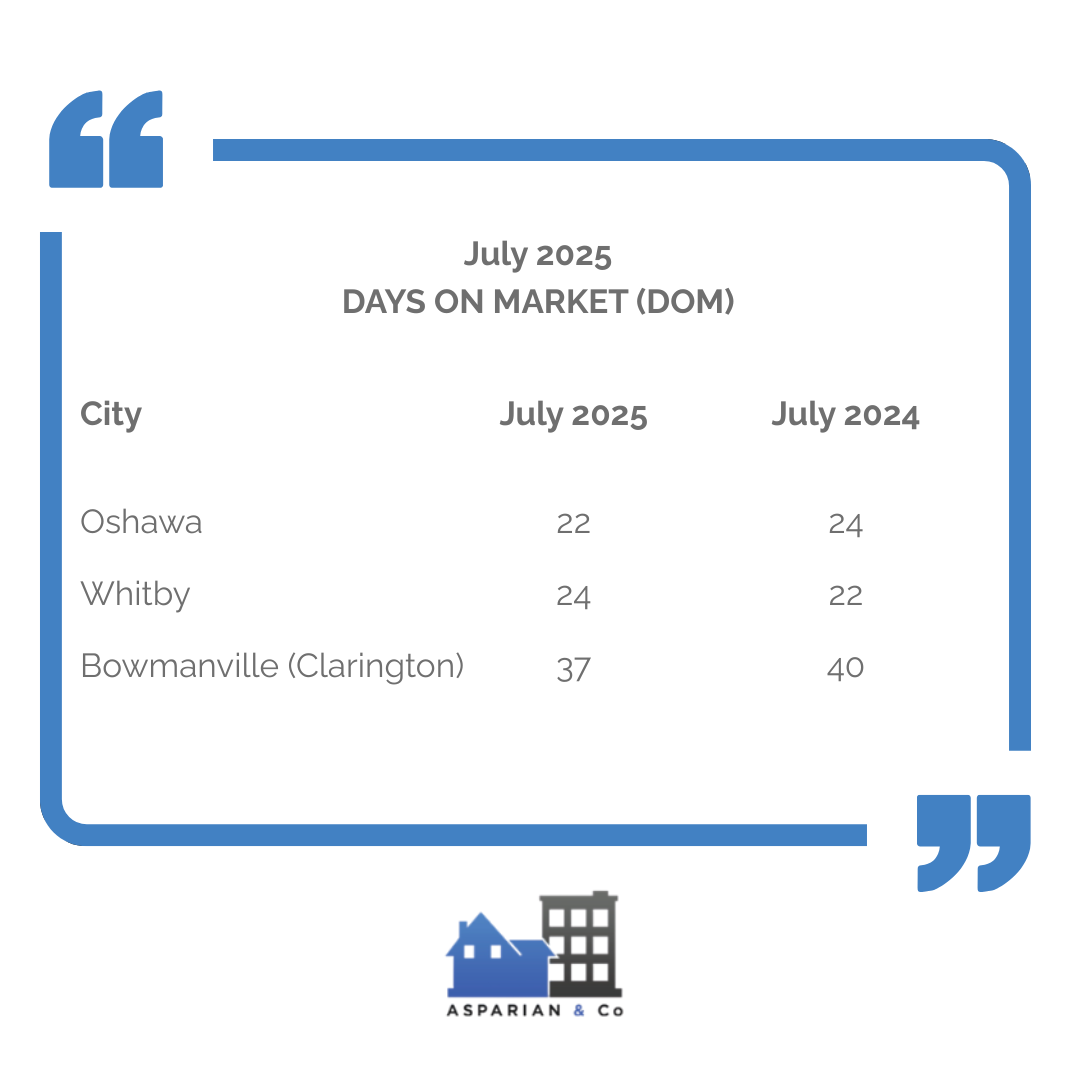
Days on Market (DOM) Comparison
The speed of sales varied meaningfully across the region. Oshawa’s DOM fell 8.3% to just 22 days, highlighting brisk buyer activity. Bowmanville also saw an improvement, with DOM shortening by 7.5% to 37 days, indicating stronger absorption of available inventory. In contrast, Whitby’s DOM rose 9.1% to 24 days, suggesting buyers are taking more time to evaluate options in a market with rapidly expanding supply.
WHAT THESE MEAN FOR BUYERS AND SELLERS
For buyers, July’s market data reinforces a shift toward conditions that allow for more measured decision-making, especially in cities like Oshawa where inventory is higher and days on market are shorter. Whitby’s surge in new listings provides ample choice, giving buyers leverage to negotiate, though stable prices suggest quality properties still command strong offers. Bowmanville’s reduced supply means competition can be fierce, requiring buyers to act decisively when the right home appears. Across all markets, the slight decline in average prices improves affordability, while consistent sale-to-list ratios indicate that fair, strategic offers are more likely to succeed than aggressive low bids. This environment rewards preparation, market awareness, and the willingness to move quickly when opportunities align.
For sellers, the data highlights the growing need for strategic positioning in a more balanced market. In Whitby, increased competition from higher inventory levels makes pricing accuracy and standout presentation essential to capturing buyer interest. Oshawa’s steady demand and quicker sales pace offer an opportunity for well-prepared listings to secure strong results, even with softened prices. Bowmanville’s lower inventory keeps conditions favorable for sellers, but buyers’ heightened sensitivity to value means overpricing can quickly push a home out of contention. Across the region, success will hinge on working closely with experienced agents to leverage current market trends, target the right buyer segments, and adapt quickly to shifting conditions.
WHAT JULY 2025 REVEALS ABOUT THE DURHAM REGION MARKET
July 2025 highlighted Durham Region’s ongoing shift toward a more balanced real estate environment, with more homes available and steady buyer demand. New listings grew across the region, giving buyers greater choice and easing the urgency that defined past markets. Sales activity remained healthy, supported by improved affordability and stable borrowing conditions, while average prices adjusted slightly from last summer’s levels. Market conditions varied by community—Bowmanville remained one of the more competitive areas, Whitby offered an expanded selection of properties, and Oshawa provided a blend of accessibility and healthy turnover. Overall, the region is showing signs of stability, where well-informed buyers and strategically minded sellers can both achieve their goals.
Need help navigating this market?
Reach out today to book a free strategy session tailored to your real estate goals. Contact Us!

