Following a brisk April, the Durham Region housing market continued to see growth in inventory through May, providing buyers with more options than in recent years. While prices have remained largely stable, sales activity is softening compared to last spring, suggesting some buyers are still waiting on the sidelines amid ongoing economic uncertainty. Sellers are adjusting their strategies as the market becomes more competitive and balanced. Spring has sprung and so has the housing activity across Durham Region. While inventory is climbing and prices remain steady, the pace of sales is showing signs of cooling compared to last year. Buyers have more choice than they’ve had in recent years, and sellers are adjusting to a more balanced playing field.
Let’s break down what’s really happening across the region.
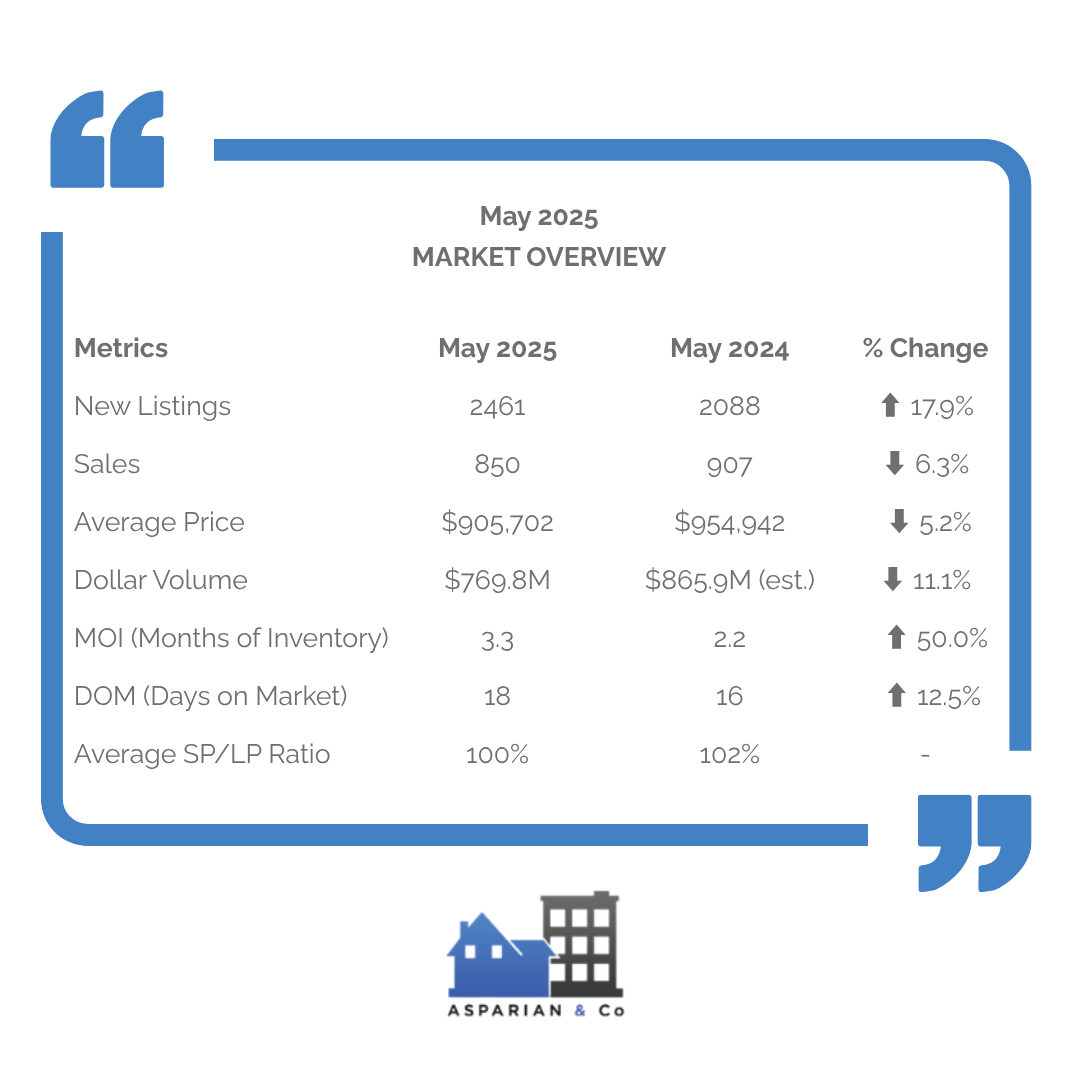
MARKET OVERVIEW
The Durham Region housing market in May 2025 reflected a noticeable shift compared to the same period last year. While new listings surged by nearly 18%, providing more options for buyers, sales activity eased and average prices saw a modest decline. These trends point toward a more balanced market environment, with longer days on market and a growing inventory signaling increased negotiation power for buyers.
CITY-BY-CITY BREAKDOWN
- Oshawa
Oshawa’s market activity held steady in May with 371 homes sold and 482 new listings hitting the market. The average sale price was $781,748, reflecting continued affordability relative to other Durham communities. With 3.3 months of inventory and homes spending an average of 19 days on the market, buyers had more room to explore their options.

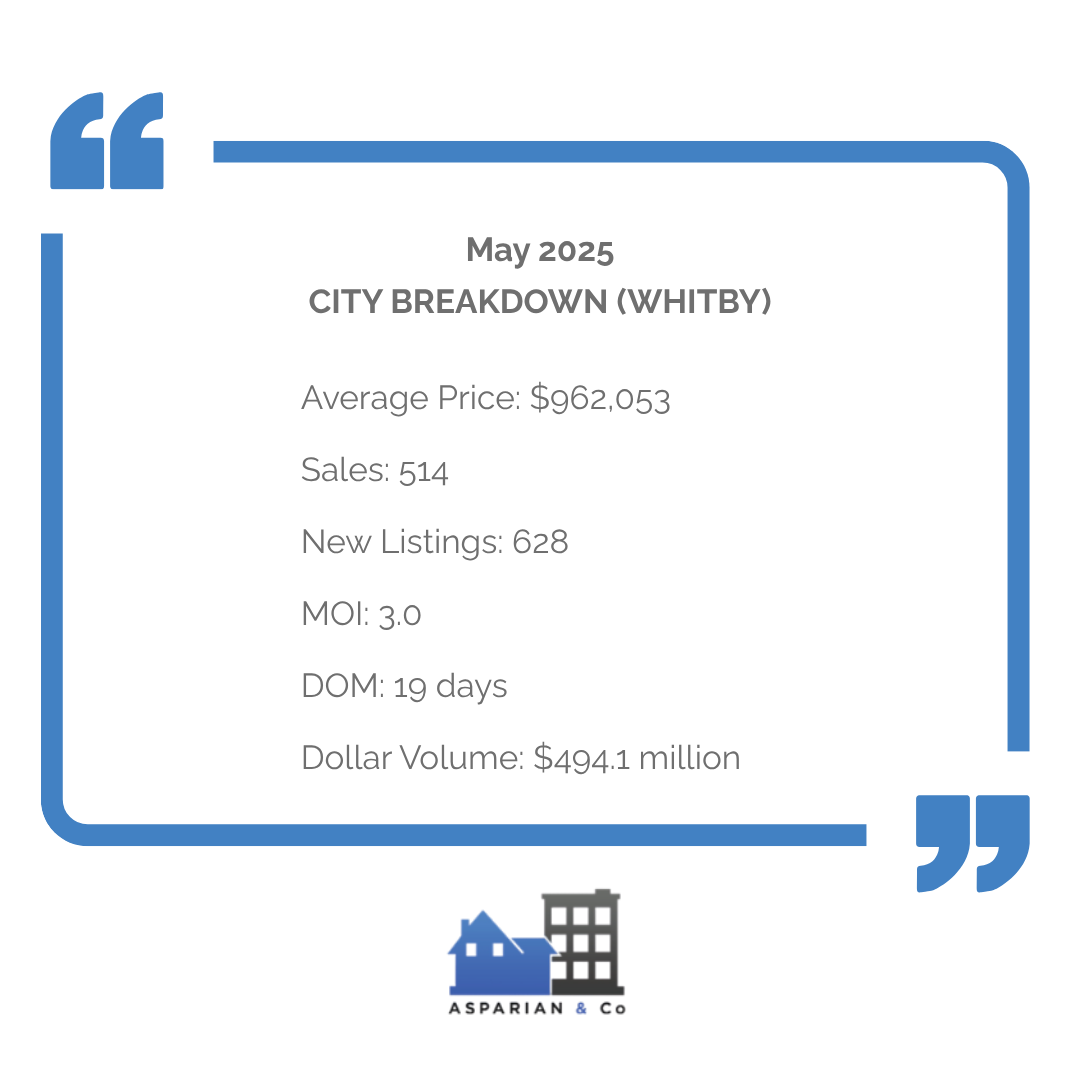
- Whitby
Whitby experienced strong listing and sales volumes in May, with 628 new listings and 514 properties sold. The average price remained solid at $962,053, indicating ongoing demand for homes in the area. Inventory levels and market pace suggest a balanced environment where both buyers and sellers can engage with confidence.
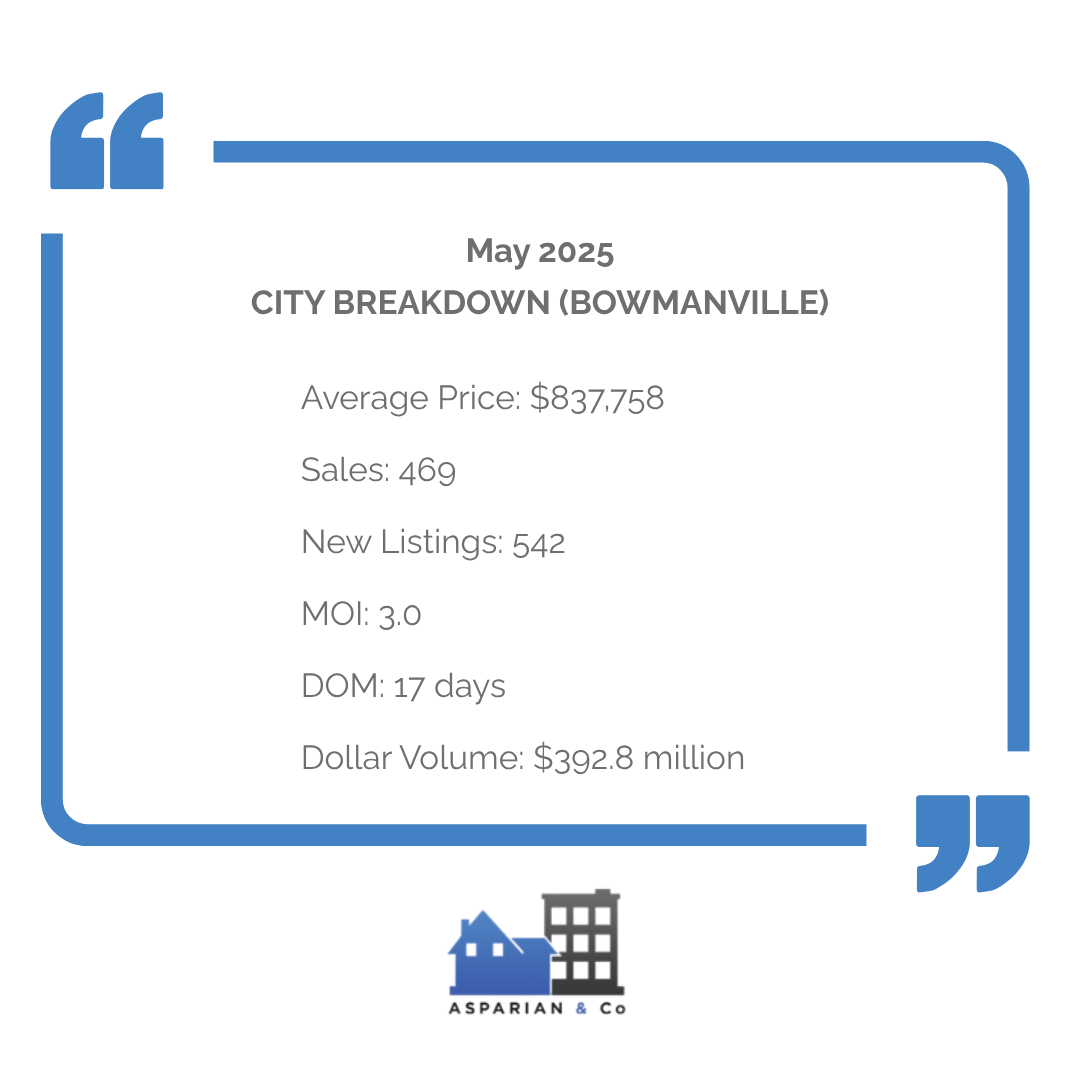
- Bowmanville
Bowmanville’s real estate market showed healthy momentum in May, with 542 new listings and 469 sales across the region. The average sale price came in at $837,758, with homes spending about 17 days on the market. A 3-month inventory and a 101% sale-to-list ratio point to a market that still slightly favors sellers while offering buyers more selection.
CITY-BY-CITY COMPARISON
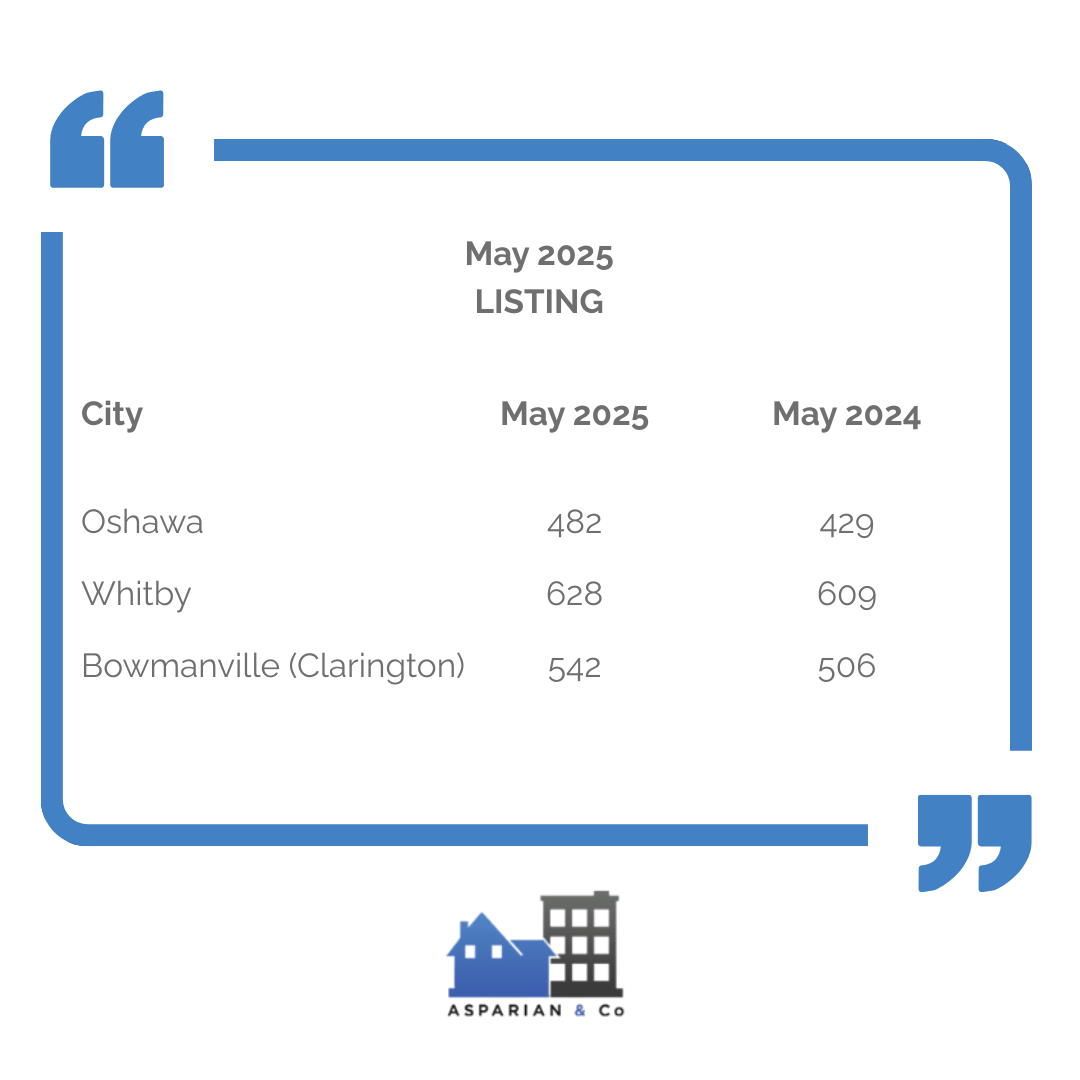
Listings Comparison
All three cities saw a rise in new listings year-over-year, with Bowmanville posting the highest increase from 506 to 542. Oshawa and Whitby also experienced notable gains, giving buyers more options in a less competitive environment. This surge in inventory reflects growing seller confidence as we enter the late spring market.
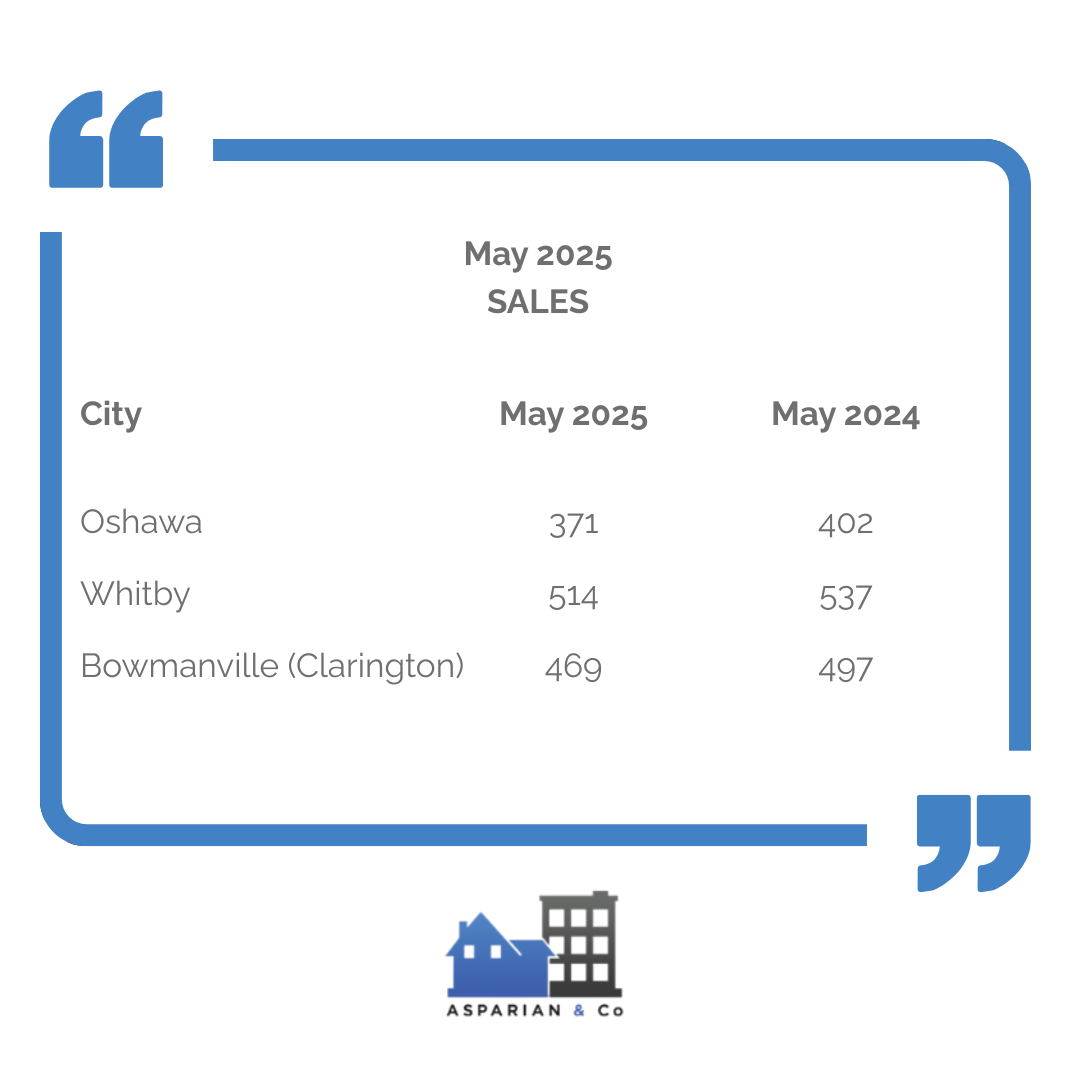
Sales Comparison
Sales declined across the board, most significantly in Bowmanville and Oshawa, suggesting that demand has softened compared to last year. Whitby showed slightly more resilience, but still experienced a dip. These declines may be tied to affordability pressures and cautious buyer sentiment amid steady interest rates.
Average Price Comparison
Average prices fell slightly in all three cities, with Bowmanville and Oshawa seeing modest declines, while Whitby remained relatively high. This downward trend may reflect buyer pushback on pricing and a shift toward negotiation-friendly conditions. Still, overall pricing remains historically elevated compared to pre-pandemic norms.

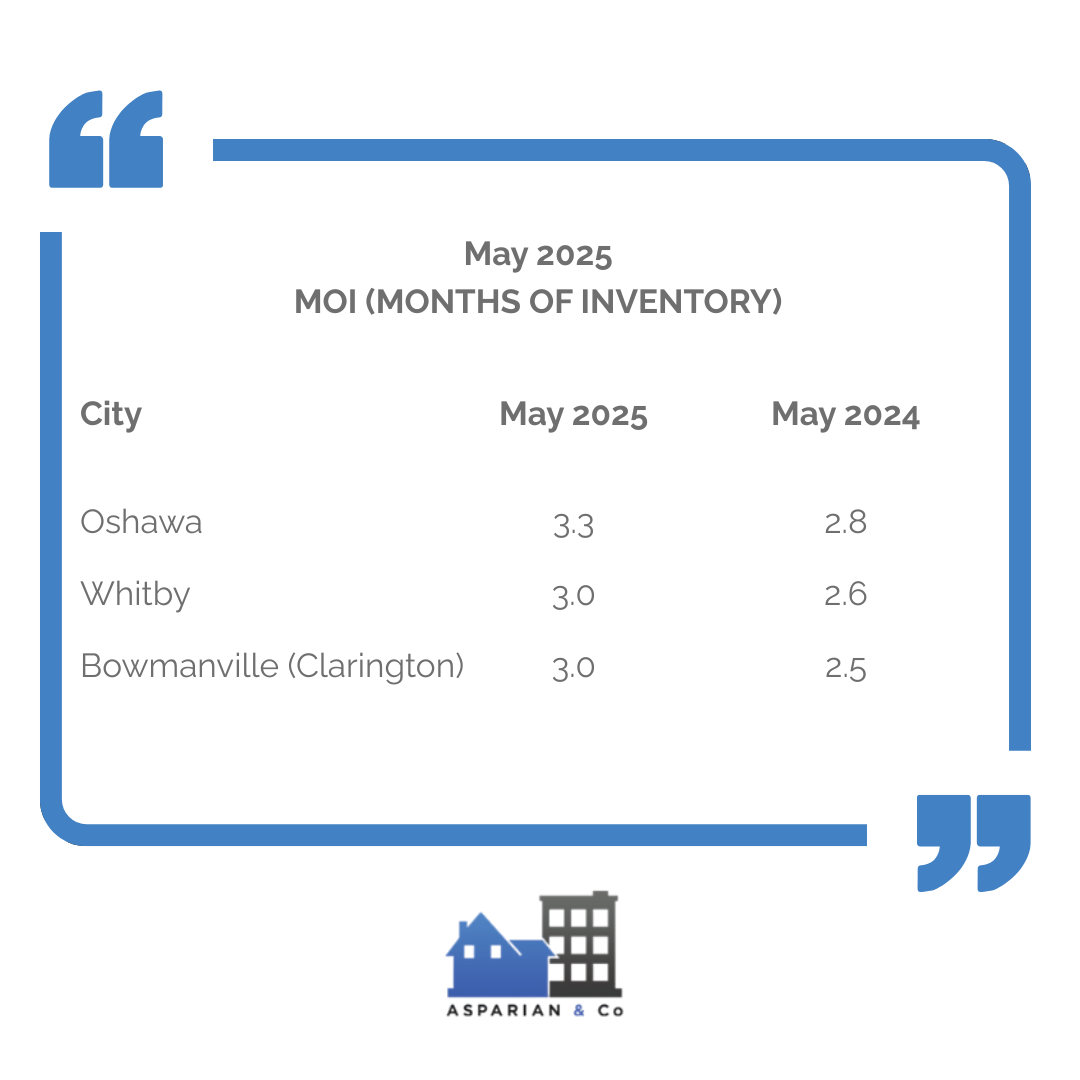
MOI (Months of Inventory) Comparison
Months of Inventory (MOI) increased across all three cities, signaling a transition toward a more balanced market. With MOI around 3.0 or higher, buyers have more leverage and less urgency to act quickly. This shift benefits buyers while nudging sellers to price more competitively.
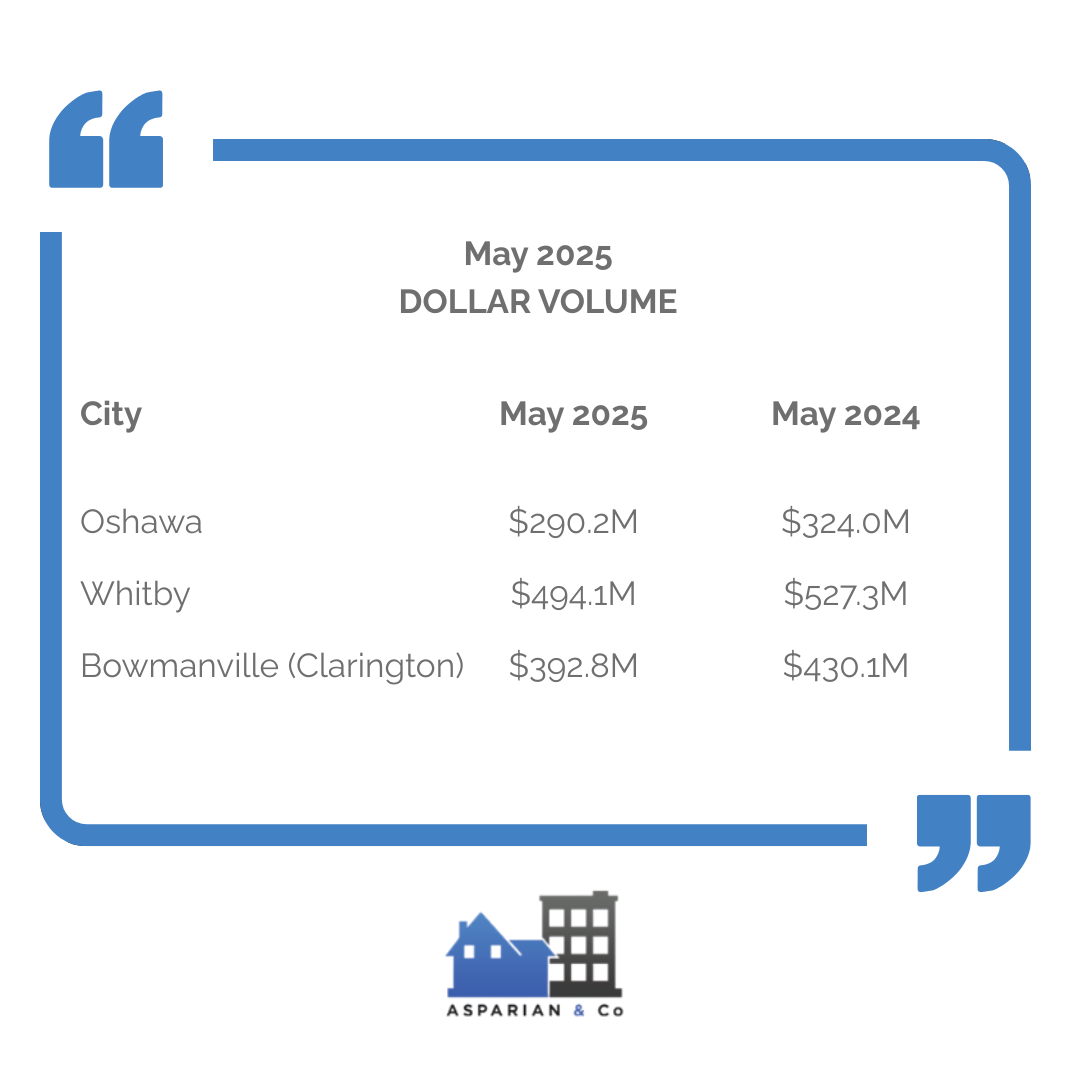
Dollar Volume Comparison
Total dollar volume dropped sharply year-over-year in each city, driven by a combination of fewer sales and slightly lower prices. Oshawa and Whitby saw the largest percentage declines, while Bowmanville still posted a strong showing despite the drop. This metric highlights the overall cooling of transaction momentum in the region.
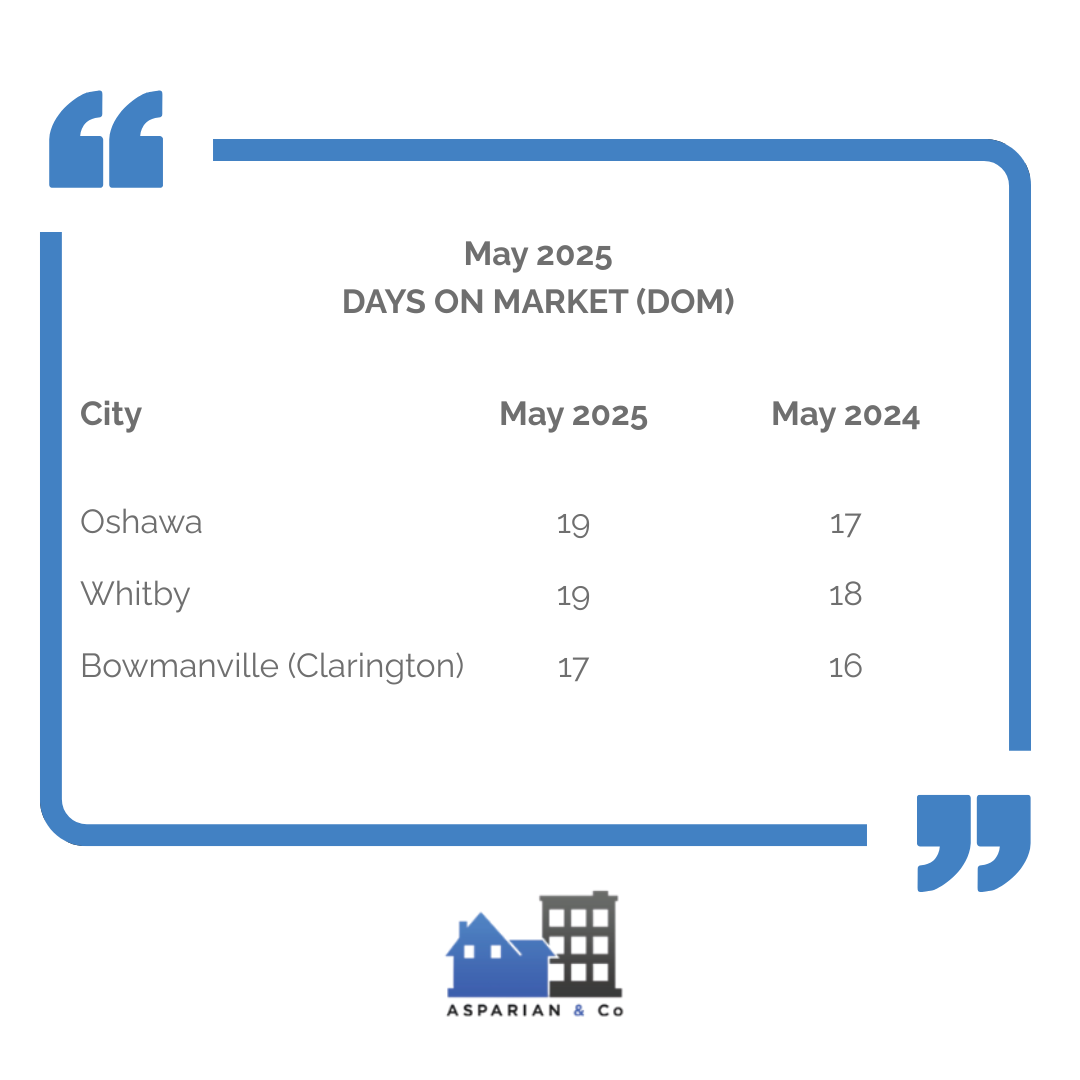
Days on Market (DOM) Comparison
Homes are taking slightly longer to sell compared to last May, with increases of 1–2 days in all three cities. While still relatively fast by historical standards, this extra time reflects a more thoughtful pace of decision-making. It’s another indicator that the market is returning to a more normalized rhythm.
WHAT THESE MEAN FOR BUYERS AND SELLERS
For buyers, the continued rise in new and active listings across Durham Region offers welcome breathing room and a broader range of options. Homes in areas like Oshawa and Bowmanville are staying on the market slightly longer, and average prices have dipped compared to last year—giving buyers more leverage at the negotiation table. With Months of Inventory rising to around 3.0, conditions are leaning more balanced, helping buyers make informed choices without rushing. Interest rates are stable, and the market pace is far calmer than the overheated climate of spring 2024.
For sellers, properties are still selling close to asking, with average sale-to-list ratios hovering around 100%, but the path to a strong sale now requires sharper strategy. Pricing too high out of the gate may result in extended days on market or missed buyer interest. Sellers who focus on curb appeal, staging, and competitive pricing—especially in high-demand categories like detached homes—can still succeed in this evolving market. The demand is still there, but buyers are more selective and better positioned to wait.
WHAT APRIL 2025 REVEALS ABOUT THE DURHAM REGION MARKET
The Durham Region real estate market in May 2025 continues to show signs of adjustment, with a clear shift toward a more balanced environment. Average sale prices across the region dipped slightly compared to last May—from $954,942 to $905,702—while the number of sales also declined, down from 907 to 850. The most significant change is the surge in supply: active listings rose 48% year-over-year to 2,798, and new listings increased by 18% to 2,461, giving buyers more choice and reducing urgency in the market.
Oshawa led in inventory growth among major cities, with new listings climbing +12.4%, while Bowmanville (Clarington) and Whitby followed with +7.1% and +3.1%, respectively. This growing gap between supply and demand reflects cautious buyer behavior amid ongoing affordability pressures and interest rate sensitivity. Still, demand remains steady—sale-to-list price ratios held firm around 100%, and homes continued to sell in under three weeks on average. Sellers who adapt with competitive pricing and good presentation remain well-positioned, while buyers benefit from a calmer, more considered environment.
Need help navigating this market?
Reach out today to book a free strategy session tailored to your real estate goals. Contact Us!

