JULY 2019 DURHAM REGION REAL ESTATE MARKET UPDATE
Summarized by Jacob Asparian, Broker
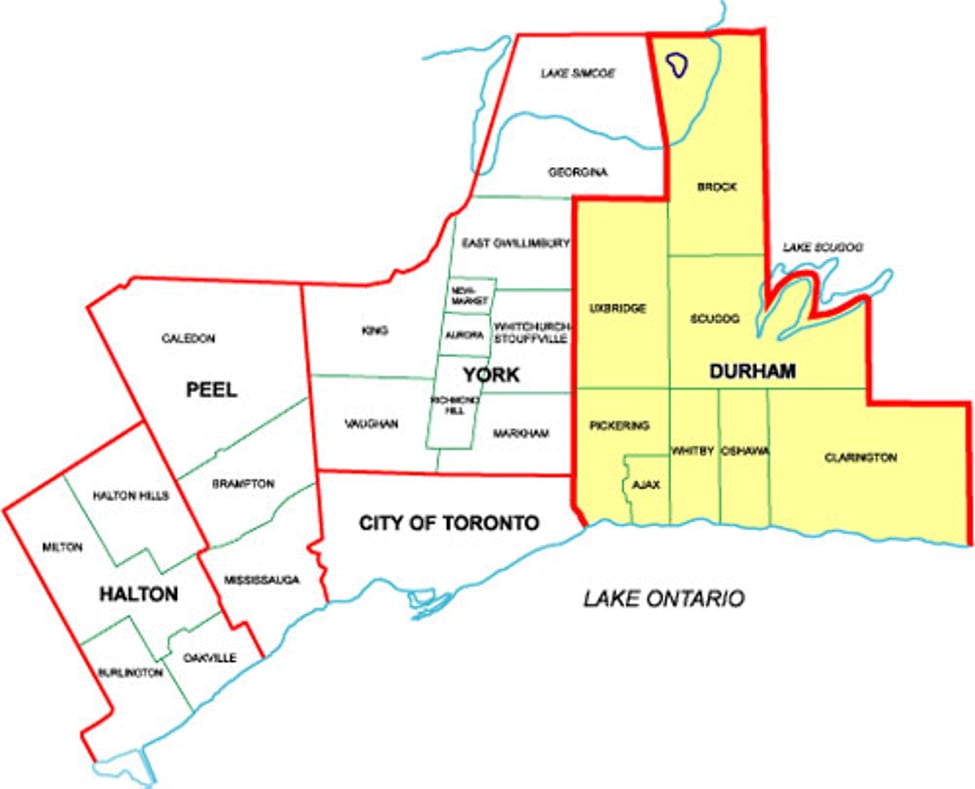
Hey what's going on everybody! Welcome back to our monthly real estate market update. Today we're going to be reviewing the numbers for Durham region as of July 2019.
To try and get a sense of what is happening in the market, we are going to look at the total number of listings, sales, and average market price in Durham Region.We will also look at current inventory benchmarks as well as a few key takeaways from the current market.
LISTINGS
We saw a total of 1892 new listings come to the market in Durham Region this July, which was an increase of almost 13% more than the 1675 that came to market last July.
Now that is also a 4% increase when you look at past year to date numbers compared to this year to date. Overall, we are generally seeing more listings coming to the market than a year ago.
SALES
We had 1041 homes sell in Durham Region in July and that is a significant increase of over 31% on the 794 that were sold in July 2018
This is a 15% increase in sales when you look at the numbers on a year over year basis.
AVERAGE SALES PRICE
So what does this mean for sales prices? The average sale price in Durham Region in July 2019 was $604,938. This is an increase of 3.6% from the 2018 average of $584,131. However, that is a decrease of $16,000 from the average sale price that we had just last month. These types of fluctuations can be expected due to seasonality and if you look at average prices over the last 12 months they have stayed quite stable.
More stats!
Now the total months of inventory in Durham Region is currently at 2.1 which means we are still in a sellers market. This is even less inventory than what we had a year ago when we were sitting at 2.8 months of inventory. What does months of inventory means? If we stopped listing homes and kept selling at the current pace, it is how long the inventory would last for.
Anything under 4 months of inventory is considered a sellers market while anything over 6 is a buyers market and everything in the middle is balanced.
Days on market have stayed fairly consistent at just over 3 weeks.
The average sale price to list price ratio was 98% and SNLR (sales to new listing ratio) is 55.0%. This means that 55.0 out of every 100 listings actually sells (which also means 45 listings are NOT selling!)
An SNLR between 40-60% is considered a balanced market with 50 being perfectly balanced. Over 60 is considered a sellers market and under 40 is a buyers. We are coming close to being a tight sellers market again.
My main takeaways for July:
-
4 consecutive months of over 1000 sales a month. (Something we haven’t seen since 2016)!
-
5 months this year we have had more listings come to market than the same period a year ago!
-
5 consecutive months of the average sales price being over $600,000, something that has not happened since the first half of 2017!
So what does that mean? Is this just a false rebound where we are going to see another correction in property values? Or is the bottom behind us and are we going to see consistent growth moving forward? No one knows for sure. There are so many variables out of our control that can affect our market that we really dont know whats going to happen in 30 days ,let alone 6-12 months.
However, in my opinion, with the stress test rules being implemented as well as buyer and seller confidence coming back, I think we should be maintaining the current trajectory of the market. Property prices should see a steady increase over the coming months and we may see multiple offers coming back in full force if demand continues to outstrip supply in Durham Region.
Having said that, this update is for all of Durham region and every single city, neighbourhood and property type is going to be affected differently. Just ask a 4 bedroom homeowner in Bowmanville and they would tell you that we're actually in a buyer's market as there's quite a bit more inventory than buyers for this market segment. Every single city and even the neighborhoods within those cities, are going to have varying numbers. If you would like a more specific market update for your city, we have an online mailing list where we will send you your cities breakdown so you can stay in the know!
As always, please keep in mind that this is just a general overview. If you are ever curious to know what your home is worth in the current real estate market, please never hesitate to reach out. We offer no cost, no obligation market evaluations for all of you out there if you are thinking of selling or want a second opinion. If you don’t necessarily want to meet with an agent just yet, no problem! Visit the link and we will send you a free online market evaluation. There is no cost or obligation for any of this.
If you enjoyed this please like and share with anyone else you think would benefit from this and be sure to like/subscribe to be kept up to date for all upcoming vlogs and blogs. Thank you so much for reading and please never hesitate to let me know if you have any questions. Until next time, have a good one!

