Welcome to your March 2025 snapshot of the Durham Region real estate market. This month reflected a changing rhythm in buyer and seller behavior: fewer listings, slower movement, but prices holding firm in most areas.
Let’s dive into the numbers that matter.
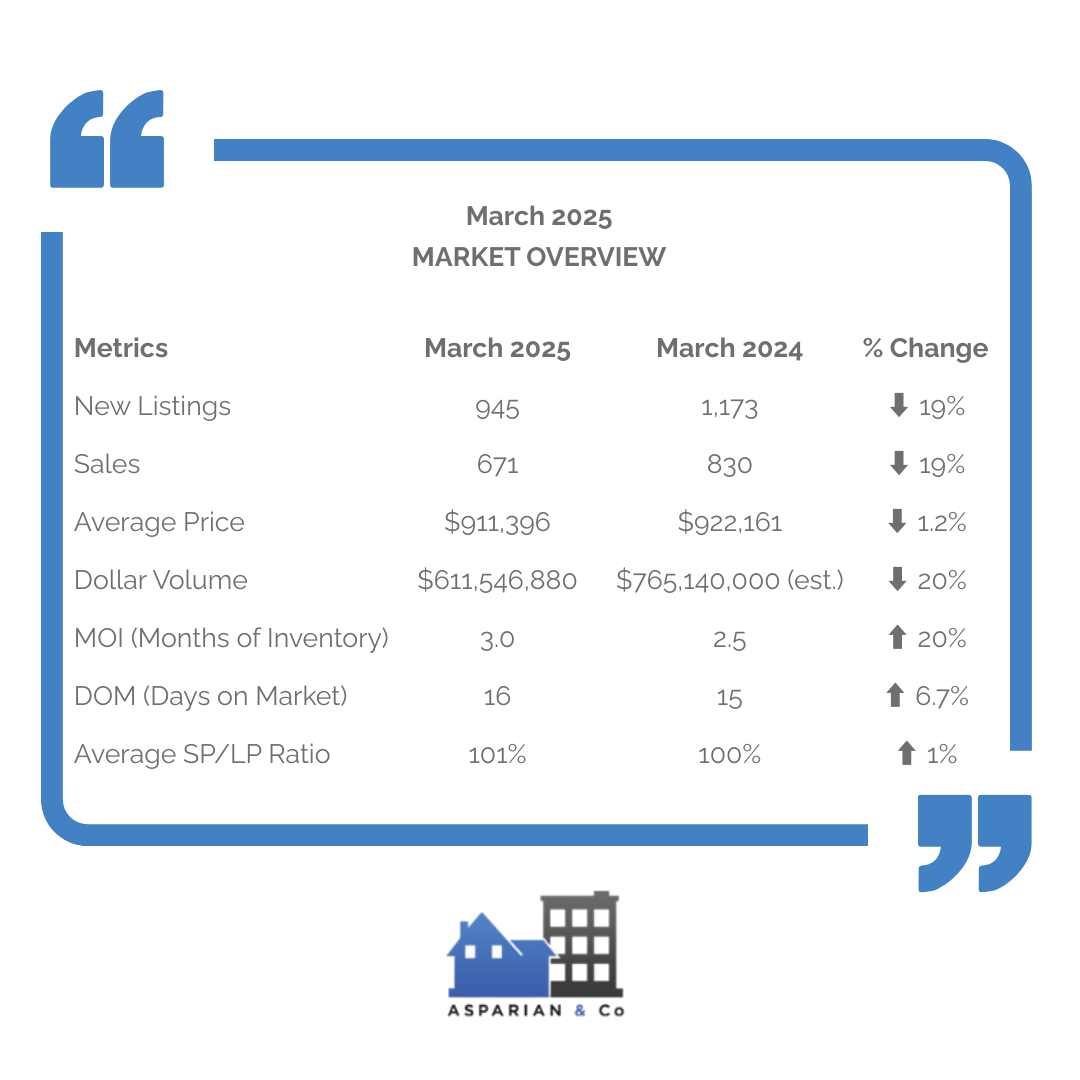
MARKET OVERVIEW
While the average price dipped slightly, inventory and time on market increased, and both sales and dollar volume fell. Sellers still hold leverage (SP/LP at 101%), but buyers are showing more caution.
The market is slightly cooler compared to last year, but seller leverage remains high with homes still selling over list price.
CITY-BY-CITY BREAKDOWN
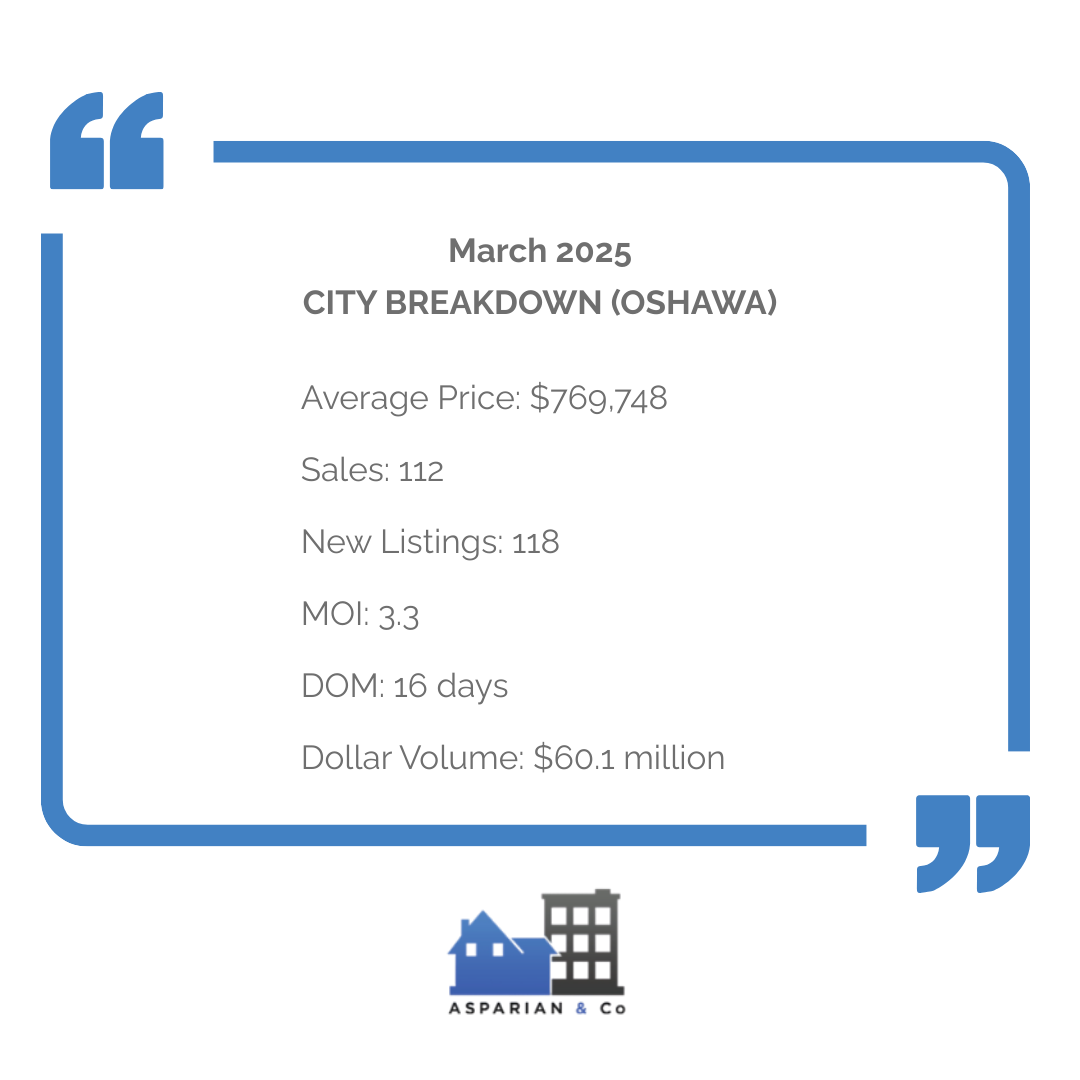
- Oshawa
Year-over-Year: Oshawa's average price is slightly down from ~$806,000 in March 2024, with steady demand and time on market unchanged.
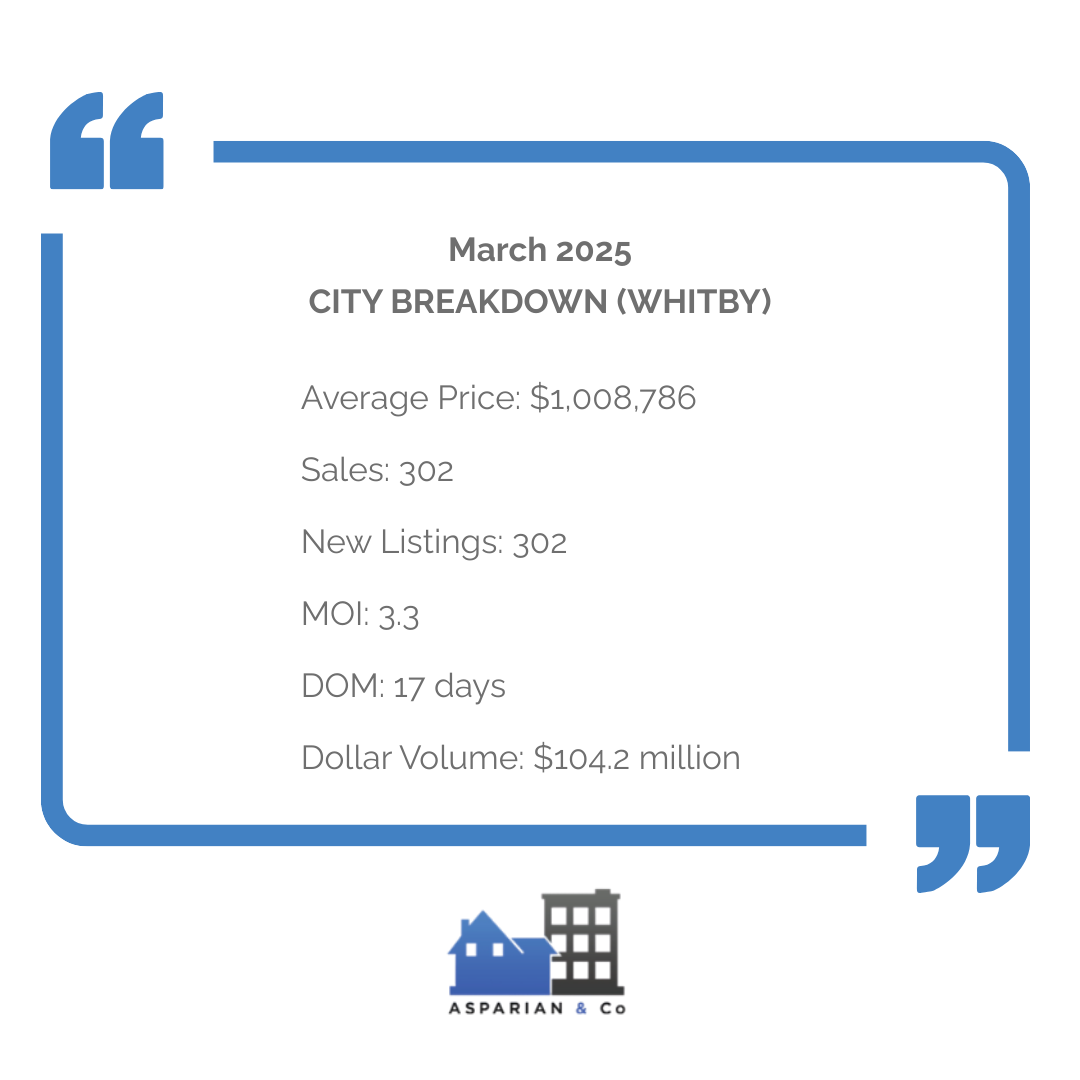
- Whitby
Year-over-Year: A mild dip from ~$1,033,707 last March. Activity remains strong and balanced with listings matching sales.
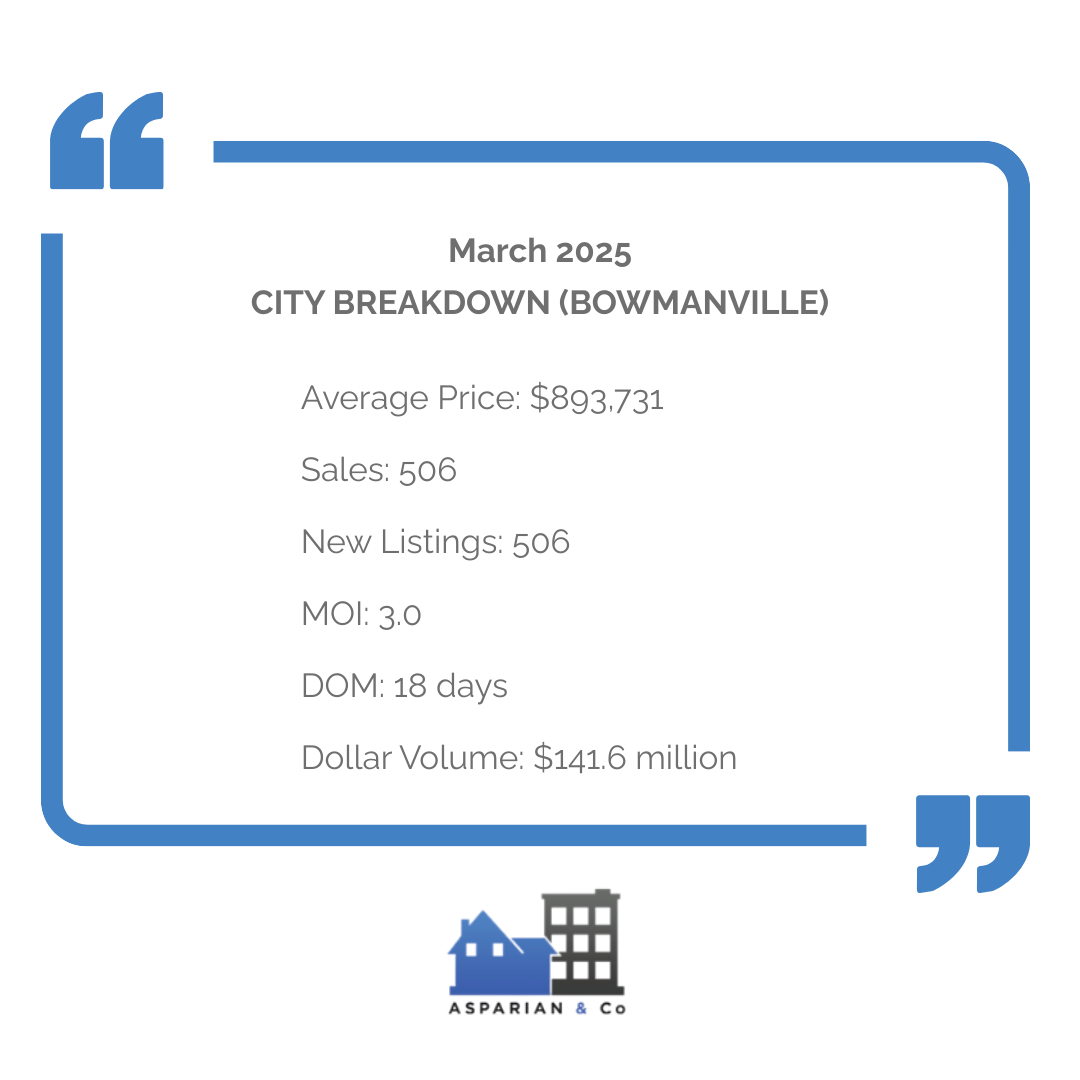
- BOWMANVILLE
Year-over-Year: Bowmanville stands out with a price increase from ~$848,344 in March 2024. Demand remains high.
CITY-BY-CITY COMPARISON
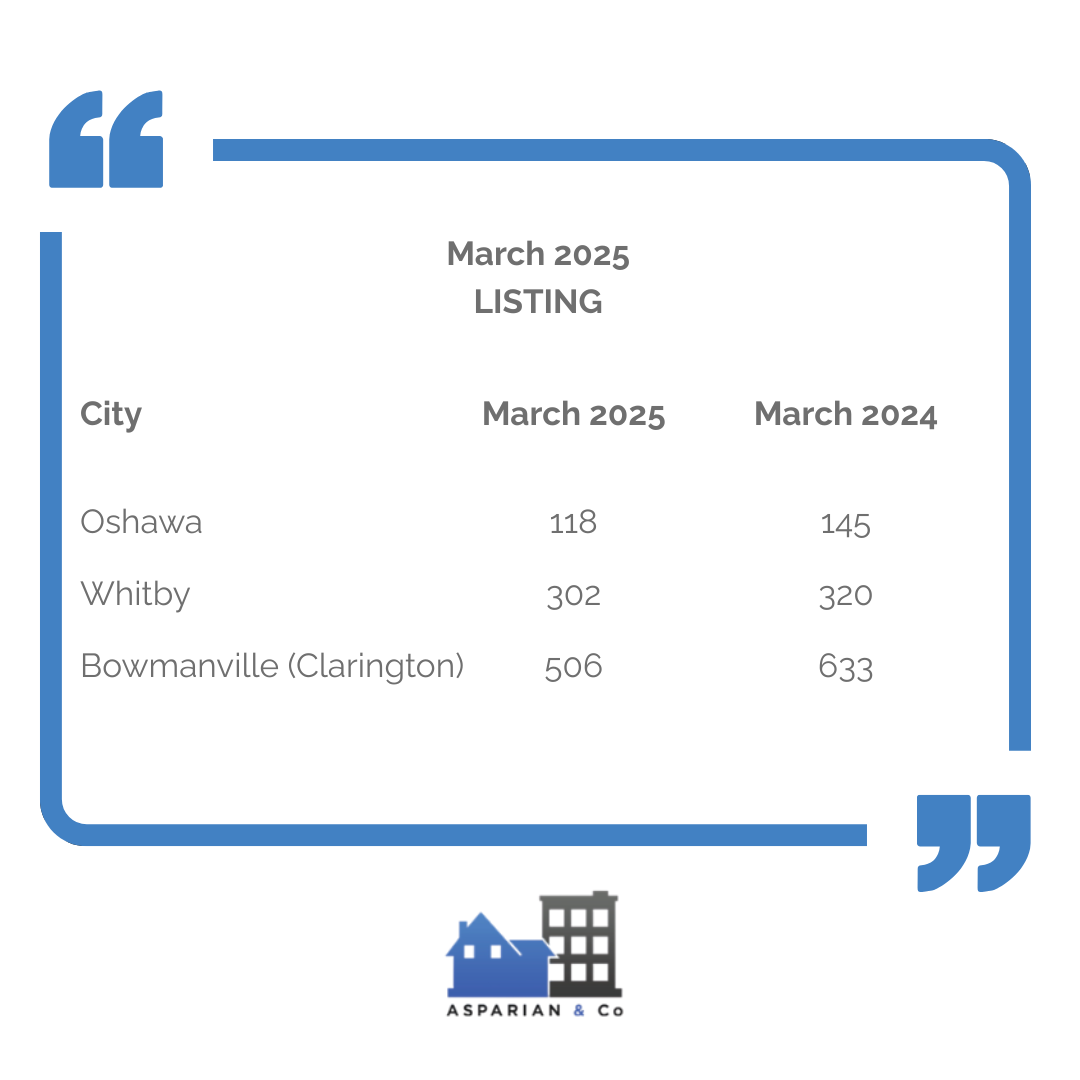
Listings Comparison
In March 2025, new listings in Oshawa, Whitby, and Bowmanville all dropped compared to the same time last year. Oshawa saw a dip from 145 to 118, while Whitby fell slightly from 320 to 302. Bowmanville experienced the largest decline, dropping from 633 to 506 listings—a 20% decrease in available inventory.
Sales Comparison
Sales activity slowed across all three cities. Oshawa recorded 112 sales in March 2025, down from 158 the previous year. Whitby and Bowmanville followed suit, dropping to 302 and 506 sales respectively—indicating a more cautious buyer pool.

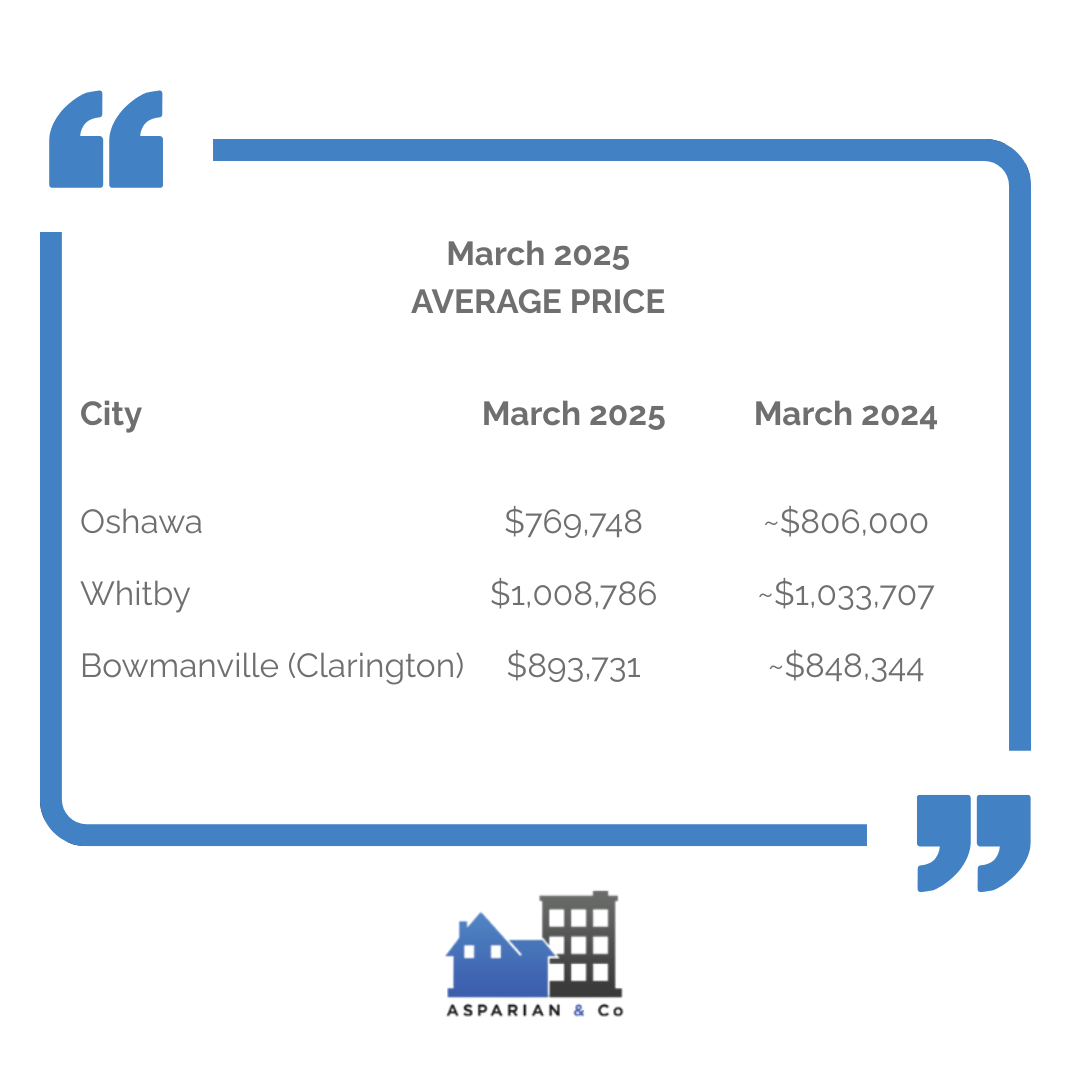
Average Price Comparison
Average home prices softened in Oshawa and Whitby but grew in Bowmanville. Oshawa’s average price declined to $769,748 from around $806,000, while Whitby dipped slightly to $1,008,786. In contrast, Bowmanville rose to $893,731—showing resilience in that submarket.
MOI (Months of Inventory) Comparison
Months of Inventory (MOI) increased slightly in all cities, suggesting homes are taking longer to sell. Oshawa and Whitby both climbed from 2.5 to 3.3 months, and Bowmanville ticked up from 2.3 to 3.0. These shifts hint at a slow pivot toward market balance.

Dollar Volume Comparison
Total dollar volume transacted declined across the board. Oshawa dropped from $69.6M to $60.1M, and Whitby followed with a slide from $112.9M to $104.2M. Bowmanville saw the steepest reduction, falling from $150.6M to $141.6M in March.

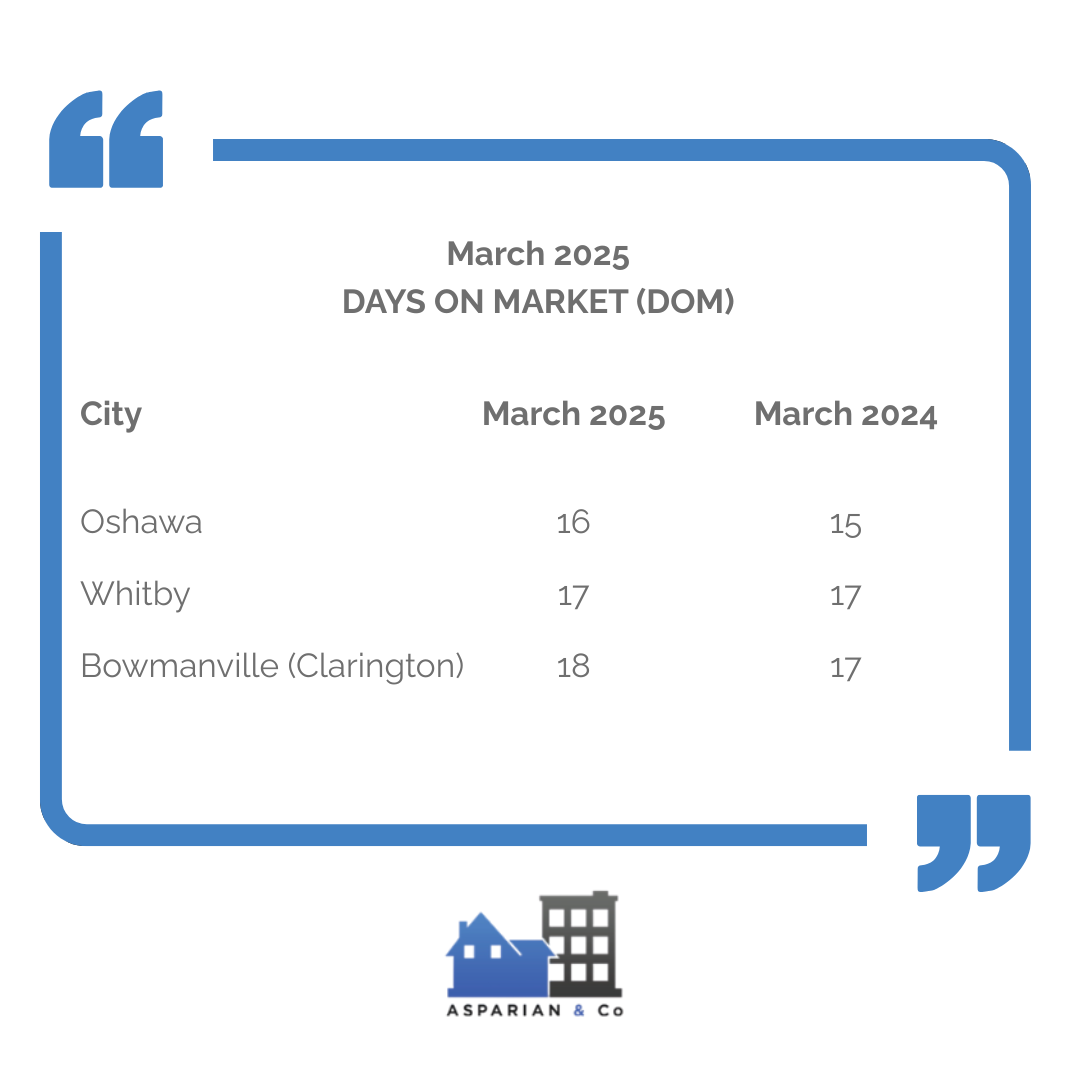
Days on Market (DOM) Comparison
Homes are staying on the market slightly longer than last year. Oshawa ticked up from 15 to 16 days, Bowmanville from 17 to 18, while Whitby remained steady at 17. This suggests a bit more breathing room for buyers—but not by much.
WHAT THESE MEAN FOR BUYERS AND SELLERS
Buyers: There’s a bit more breathing room than last year—but don’t wait too long. Inventory is still tight and properties are selling quickly.
Sellers: Demand remains strong. If your home is priced right, it can still go over asking—especially in sought-after areas like Whitby and Bowmanville.
WHAT MARCH 2025 REVEALS ABOUT THE DURHAM REGION MARKET
The Durham Region real estate market in March 2025 is showing signs of stabilization after the aggressive pace of the past few years. While the average price dipped slightly year-over-year, the bigger story is the simultaneous drop in both sales and new listings across Oshawa, Whitby, and Bowmanville. This suggests that both buyers and sellers are approaching the market with more caution—likely due to continued economic uncertainty and interest rate sensitivity. However, properties are still selling quickly and at strong prices, with most cities recording sale-to-list price ratios at or above 100%. The increase in Months of Inventory (MOI) and slightly longer Days on Market (DOM) also hint at a slow shift toward more balanced conditions, though we are still firmly in a seller’s market territory.
One standout this month is Bowmanville (Clarington), which saw an increase in average sale price year-over-year, bucking the regional trend. This signals that demand remains strong in certain pockets, particularly in areas perceived as offering better value relative to the rest of the GTA. While total dollar volumes declined across all three cities—indicating fewer or lower-value transactions—the underlying competitiveness remains. Buyers may have a bit more breathing room than last year, but they still need to act quickly on well-priced homes. For sellers, this is a moment to be strategic: homes that show well and are priced appropriately can still attract multiple offers. The market may be shifting, but opportunities remain strong on both sides.
Need help navigating this market?
Reach out today to book a free strategy session tailored to your real estate goals. Contact Us!

